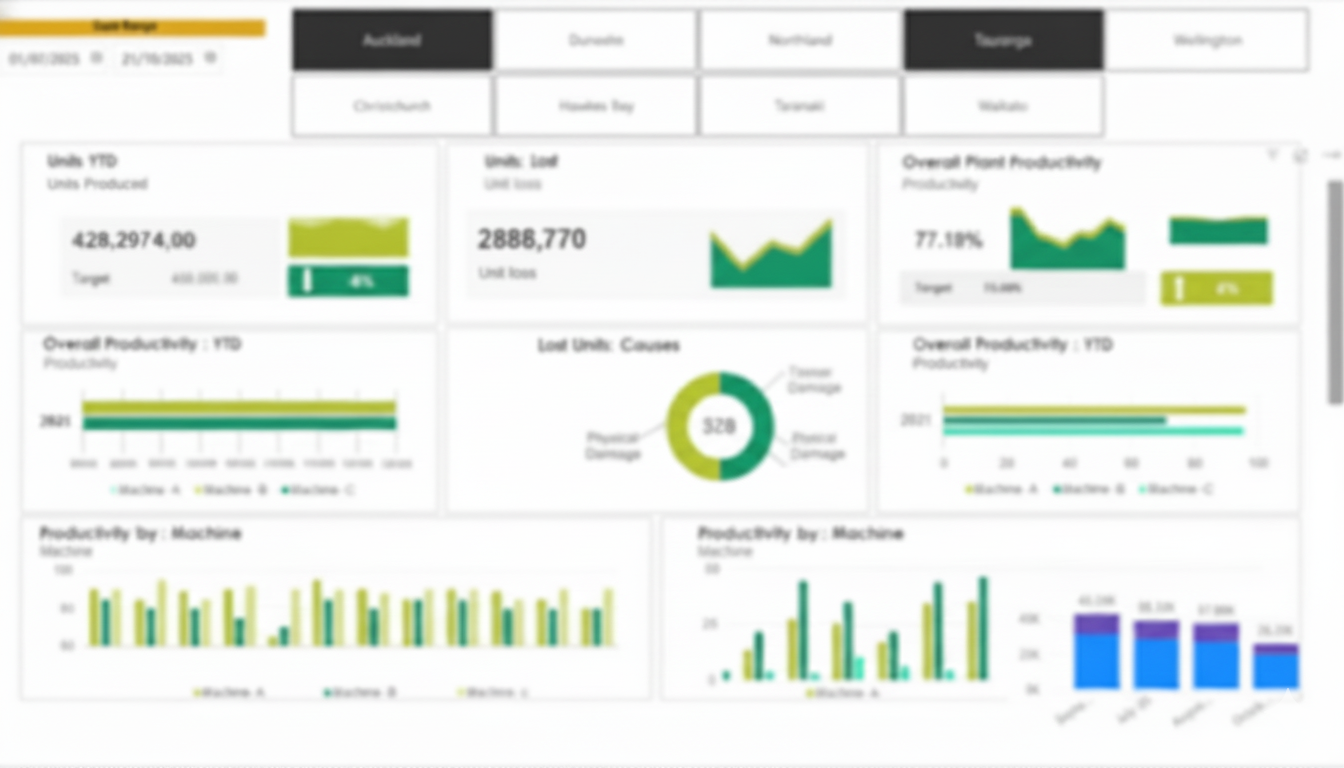
Business Intelligence Dashboards for Operational Visibility
Stop digging through multiple systems to answer basic questions. Get current reporting across sales, operations, finance, and delivery.
Talk Through Your ReportingKey Benefits
Real-Time Visibility
See what's happening right now, not last week or last month.
One Source of Truth
All your data in one place. No more conflicting reports.
Faster Decisions
Spot trends, risks, and bottlenecks early enough to act.
Automatic Updates
Data refreshes automatically. No more manual report creation.
Operational Focus
Track the metrics that show how work, stock, jobs, people, and margin are moving.
Actionable Insights
Not just data — useful visibility that supports practical decisions.
The problem: death by spreadsheet
Your business data is scattered everywhere — accounting systems, CRM, inventory management, e-commerce platforms, marketing tools, project management software. Each system speaks its own language. None of them give you the whole picture.
Want to answer a simple question like "Are we on track this month?" You're looking at an hour of work. Export data from five different systems. Copy everything into a master spreadsheet. Fix the formulas that broke. Create new charts. Email it to stakeholders.
And by the time you hit send, the data is already out of date.
What is a business intelligence dashboard?
A business intelligence dashboard is a practical reporting layer across the systems your business already uses. It pulls the important numbers into one place so you can see what is happening without waiting for manual exports, spreadsheet clean-up, or end-of-month reporting.
For operational businesses, the goal is usually simple: make the right numbers visible early enough to act.
What your dashboard can show you
Financial metrics that matter: Revenue, expenses, profit margins, cash flow, and job or site profitability.
Sales performance: Pipeline value, conversion rates, deals won and lost, quote follow-up, and sales activity by source or person.
Operational efficiency: Productivity rates, capacity utilisation, process efficiency, job status, backlog, and bottlenecks.
Customer insights: Satisfaction scores, retention rates, lifetime value, repeat business, and enquiry quality.
Marketing ROI: Lead generation, campaign performance, cost per acquisition, and which channels actually create useful work.
What makes business dashboards valuable
Current data: See what's happening now, not what happened last week. Make decisions based on today's reality.
Historical trends: Compare to previous periods. Understand seasonal patterns. Spot issues before they become normal.
Forecasting: Project future performance based on current trajectory. Plan proactively instead of reacting.
Automated alerts: Get notified when metrics go off track. Fix problems while they're still small.
Drill-down capability: Click any number to see the details behind it. Understand the "why" behind every metric.
Dashboard development process
1. Discovery workshop
We start by understanding your business, not your data. What decisions keep you up at night? What metrics actually drive those decisions? Who needs to see what information, and when? Where does that data live right now?
This is not about building pretty charts. It is about giving you the visibility you need to run your business better.
2. Dashboard design
We create mockups showing exactly what your dashboard will look like. Every metric, every chart, every filter. How it looks on your desktop. How it looks on your phone when you're checking numbers away from the office.
You see it, you approve it, we build it.
3. Data integration
This is where the dashboard becomes useful. We connect the relevant systems — accounting, CRM, inventory, job management, e-commerce, rostering, or whatever combination makes sense. We extract the data, clean it up, transform it into a consistent format, and set up automatic refreshes so it stays current.
Your systems might not talk to each other, but we make the important data flow.
4. Dashboard build
We implement the approved design. Build the visualisations. Add drill-down capability so you can investigate details. Create filters and date ranges. Test on the devices your team actually uses.
The goal is simple: the metric you need, easy enough to find and current enough to use.
5. Training and handover
We do not just hand you a dashboard and walk away. Your team learns how to use it, how to interpret the metrics, how to drill down for details, and how to request changes as your business evolves.
The dashboard should become part of your operating rhythm, not another report nobody opens.
Dashboard examples by industry
Recruitment agency dashboards
Track what matters in recruitment: active jobs versus available candidates, time to fill positions, placement revenue by consultant, candidate pipeline by stage, and client satisfaction scores.
See immediately when you have more jobs than candidates, which consultants are hitting targets, and where candidates or clients are getting stuck.
Connected systems: ATS, accounting, client surveys
Professional services dashboards
Monitor billable hours by project and client. Track utilisation rates by staff member. See work in progress value, outstanding invoices aging, and project profitability in one place.
Spot underutilised staff early enough to rebalance workloads. Identify unprofitable projects before they drain resources.
Connected systems: Time tracking, project management, accounting
Operational dashboards
You already know how to check the pulse of your business. The problem is getting to those numbers quickly enough to do something about them.
Leading indicators: Pipeline value dropping. Customer inquiries trending down. Inventory turning slower. Jobs waiting too long in one stage. Whatever tells you what is coming before it hits your bottom line.
Lagging indicators: Revenue, profit, customer churn, completed jobs, and final margin. Important for understanding results, but often too late to prevent problems.
We help you track both — the metrics you already know matter, just accessible in real time instead of buried in spreadsheets.
Connected systems: Whatever you're currently using — accounting, sales, operations, inventory, CRM, e-commerce, job management, rostering, or whatever combination makes sense for your business.
Technology we use for business intelligence
Dashboard platforms
Microsoft Power BI: A common recommendation for businesses already using Microsoft 365. It is powerful, flexible, and designed for business intelligence reporting.
Google Looker Studio: Useful for businesses already using Google Workspace or marketing platforms. Good for lightweight reporting and dashboard prototypes.
Custom dashboards: When off-the-shelf will not cut it. Built to your specifications and, where needed, embedded directly in your existing systems.
We recommend the right tool for your needs, not the one we are most comfortable with.
Data integration
Power Automate & Power BI Dataflows: The Microsoft Power Platform approach for small to medium businesses. Automate data collection from multiple sources, schedule refreshes, and transform data as it flows through.
API connections: Direct connections to your source systems. Useful when you need more current data and less manual exporting.
Custom ETL processes: When your systems do not play nicely with standard tools, we build custom extract, transform, and load processes to prepare the data for your dashboards.
Investment in business intelligence
Dashboard costs depend on complexity. How many data sources? How complex are the calculations? How many users? How often does it need to update? Platform-based or fully custom?
Typical Investment:
- Discovery and Design: $2,000-5,000 to understand what you actually need
- Initial Dashboard Build: $5,000-20,000 depending on complexity
- Ongoing Platform Costs: $50-500/month for the software itself
- Ongoing Updates/Support: As needed as the business changes
ROI comes from two places: hours saved from manual reporting, and better decisions from acting on current data instead of guesswork.
What you get
Initial delivery
A functional dashboard with data automatically updating on your schedule. User access configured for everyone who needs it. Mobile-ready design that works on the devices your team uses. Documentation so the setup is not mysterious.
Training that sticks
Your team learns how to use the dashboard, interpret the metrics, drill down for details, and request changes.
Ongoing support
Your business changes. Your dashboard should too. New metrics, different data sources, modified calculations — we handle it, or we document enough for your team to handle simple updates themselves.
Next steps: get clear on your numbers
Book a reporting discovery session. We will identify the key metrics you actually need to track, review your current reporting process, and find the places where data is too slow, too manual, or too hard to trust.
No obligation. No sales pitch. Just a practical conversation about whether a business intelligence dashboard would improve how you run the business.
Ready to Find the Operational Leakage?
Every business has a few places where systems, reporting, or manual handovers are quietly costing time and margin. Let's work out whether yours are worth fixing now.
Talk Through Your Systems